


Visualize+ by Healthie
Available now
Stop exporting reports. Start making decisions.
Visualize+ gives your team interactive, customizable dashboards built on your Healthie data. No code, no technical team, no waiting on exports.
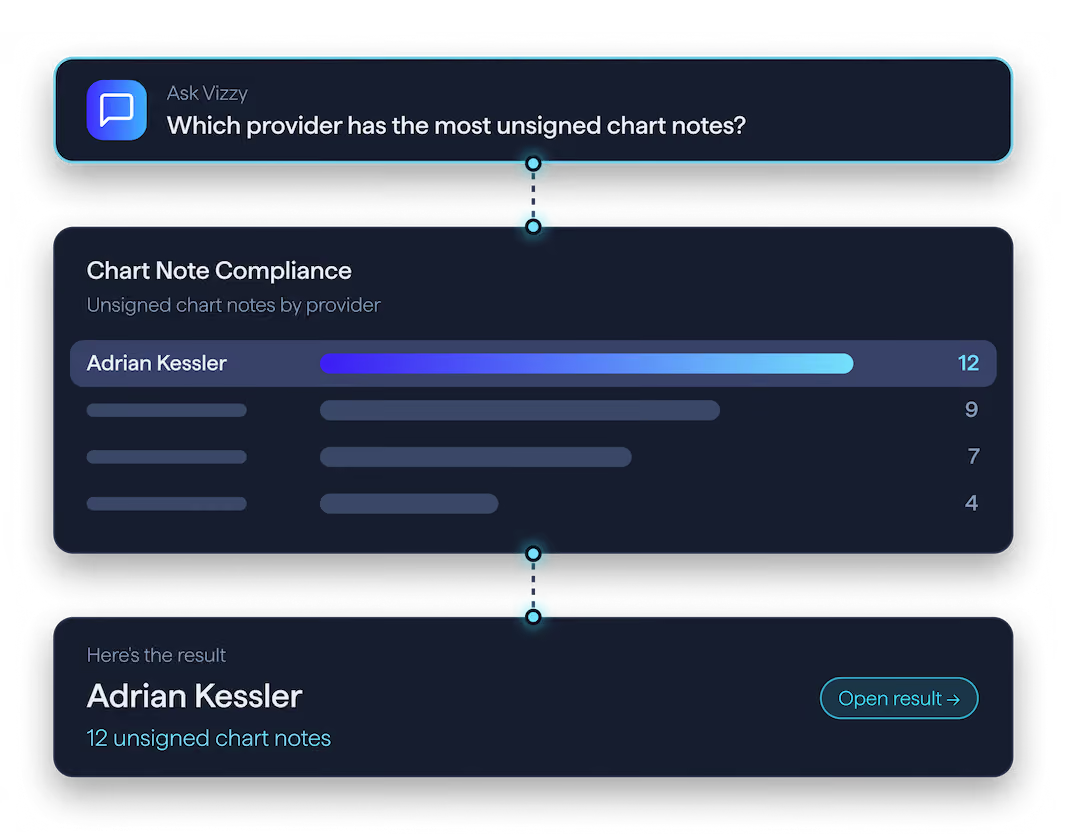
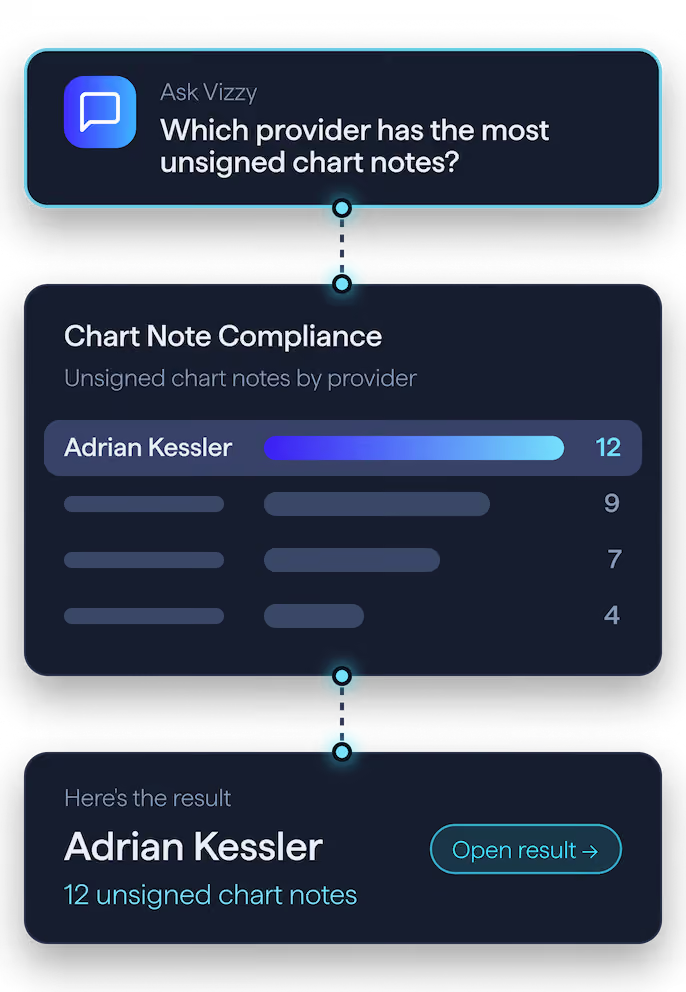
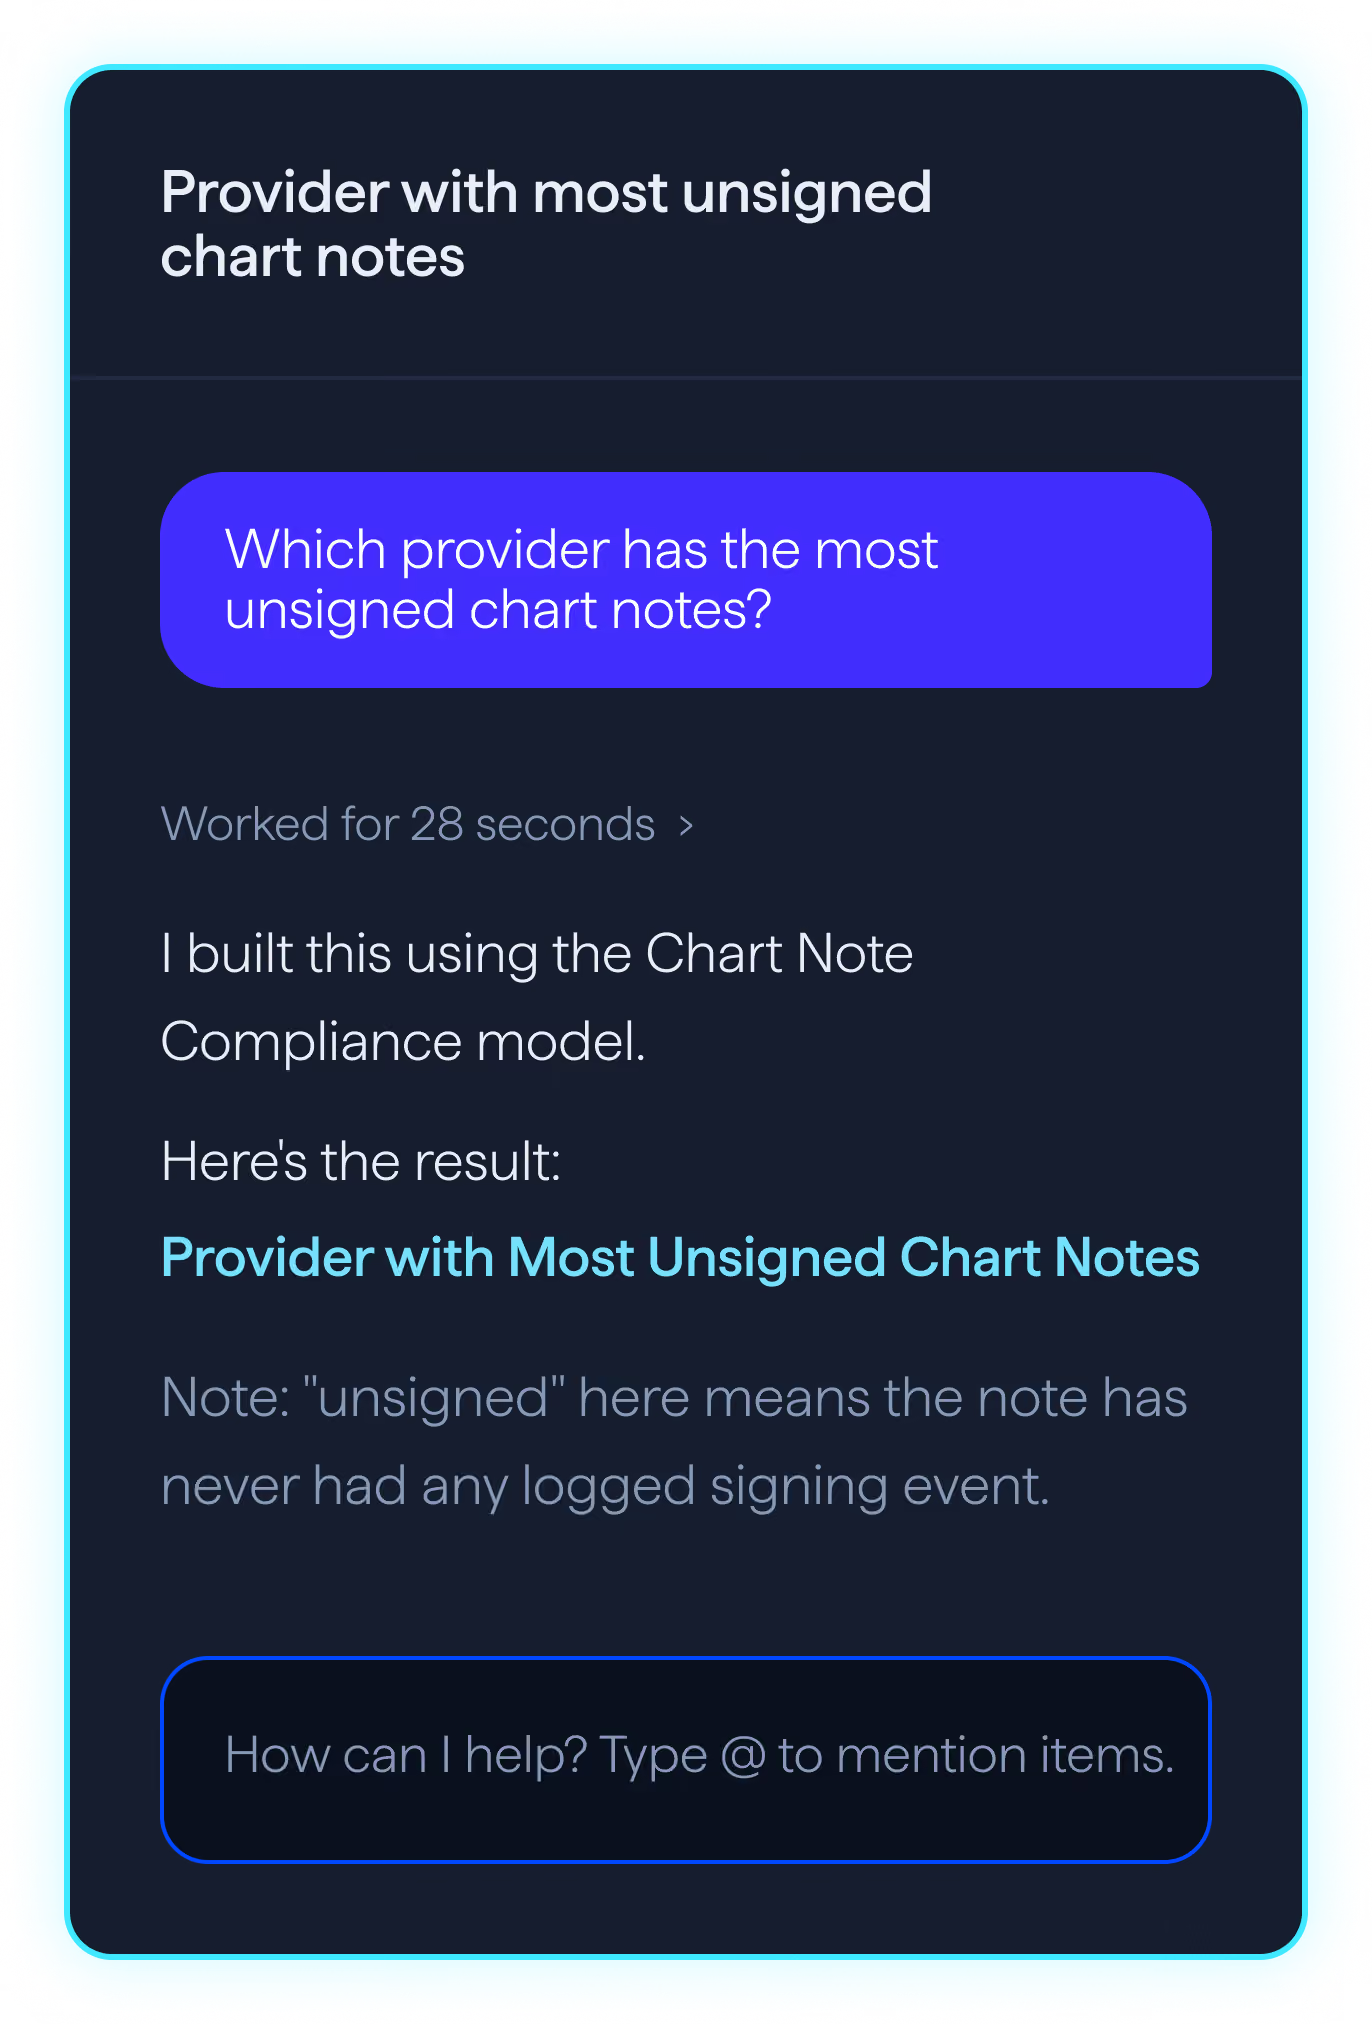
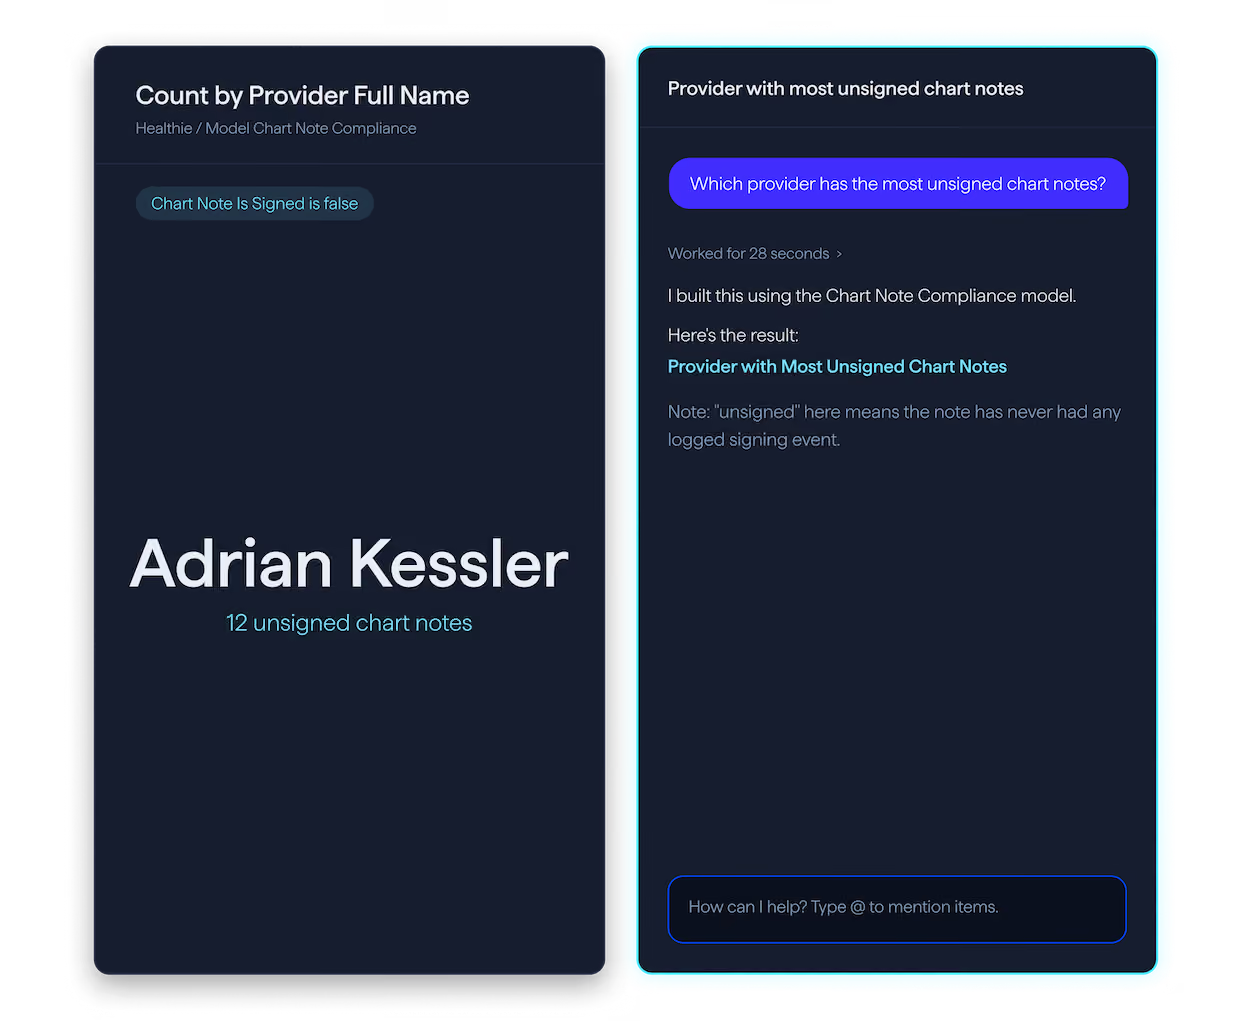
Which provider has the most unsigned chart notes?
STATIC VS INTERACTIVE
Exports are fixed. Dashboards are yours to explore.
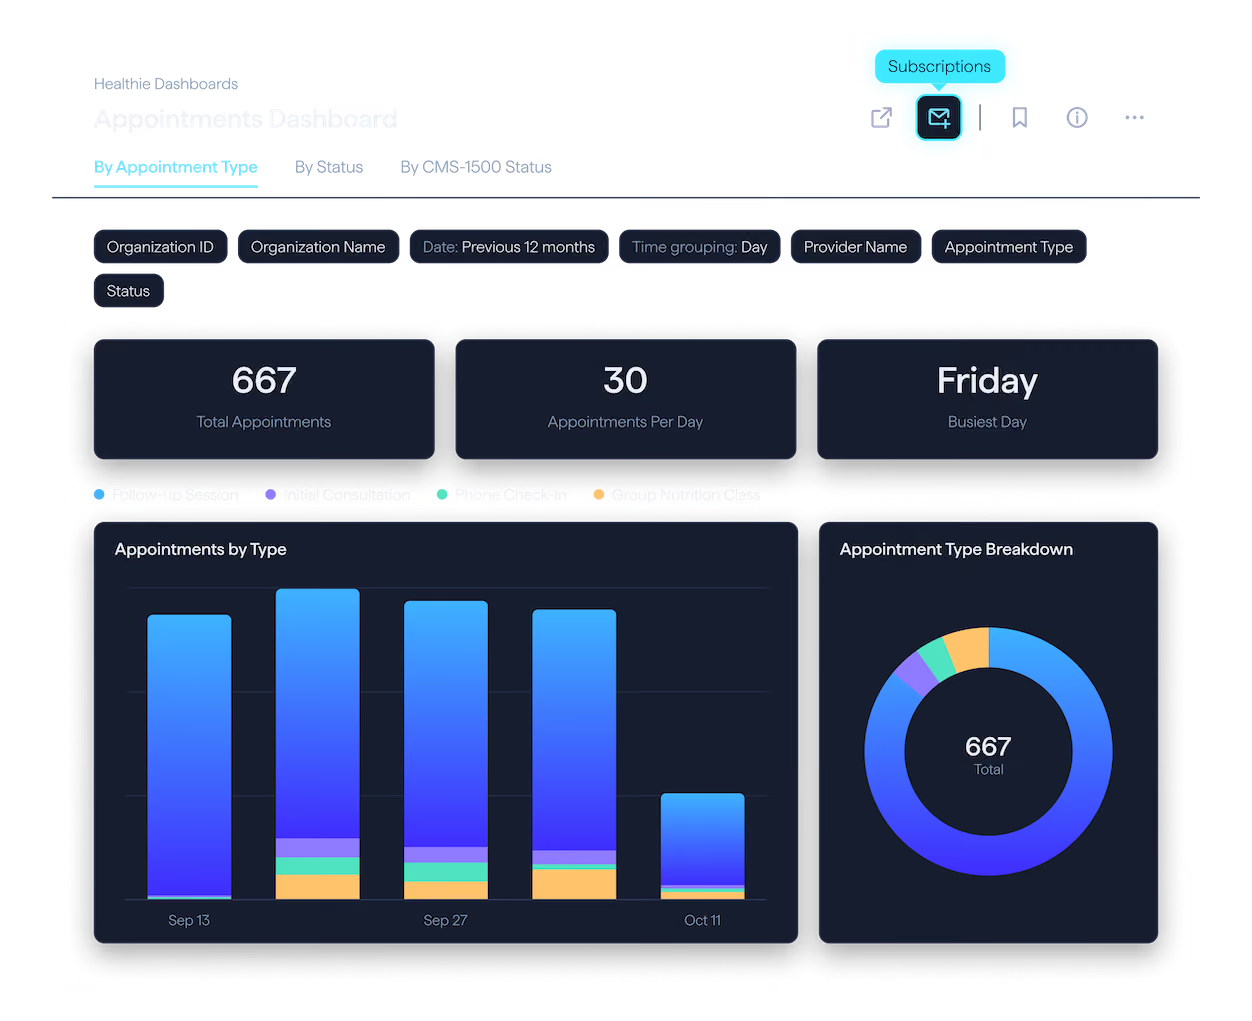
The moment a report is exported, it starts going out of date, and every new question means a new request. Visualize+ dashboards refresh on the same schedule as your in-app reports, and anyone with access can filter, customize and drill through.
Exported report
Freshness
Out of date the moment it is exported
Changing it
Submit a request, wait for a new export
Access
Fixed columns, for whoever gets the file
Sharing
Attachments and copies that drift apart
INTERACTIVE
Visualize+ dashboard
Freshness
Refreshes on the same schedule as in‑app reports
Changing it
Filter, regroup and drill through, no code
Access
Role-based, for everyone who needs it
Sharing
Share a filtered view, schedule it or set goal-line alerts
ROLE-BASED DASHBOARDS
Dashboards for every role in your organization
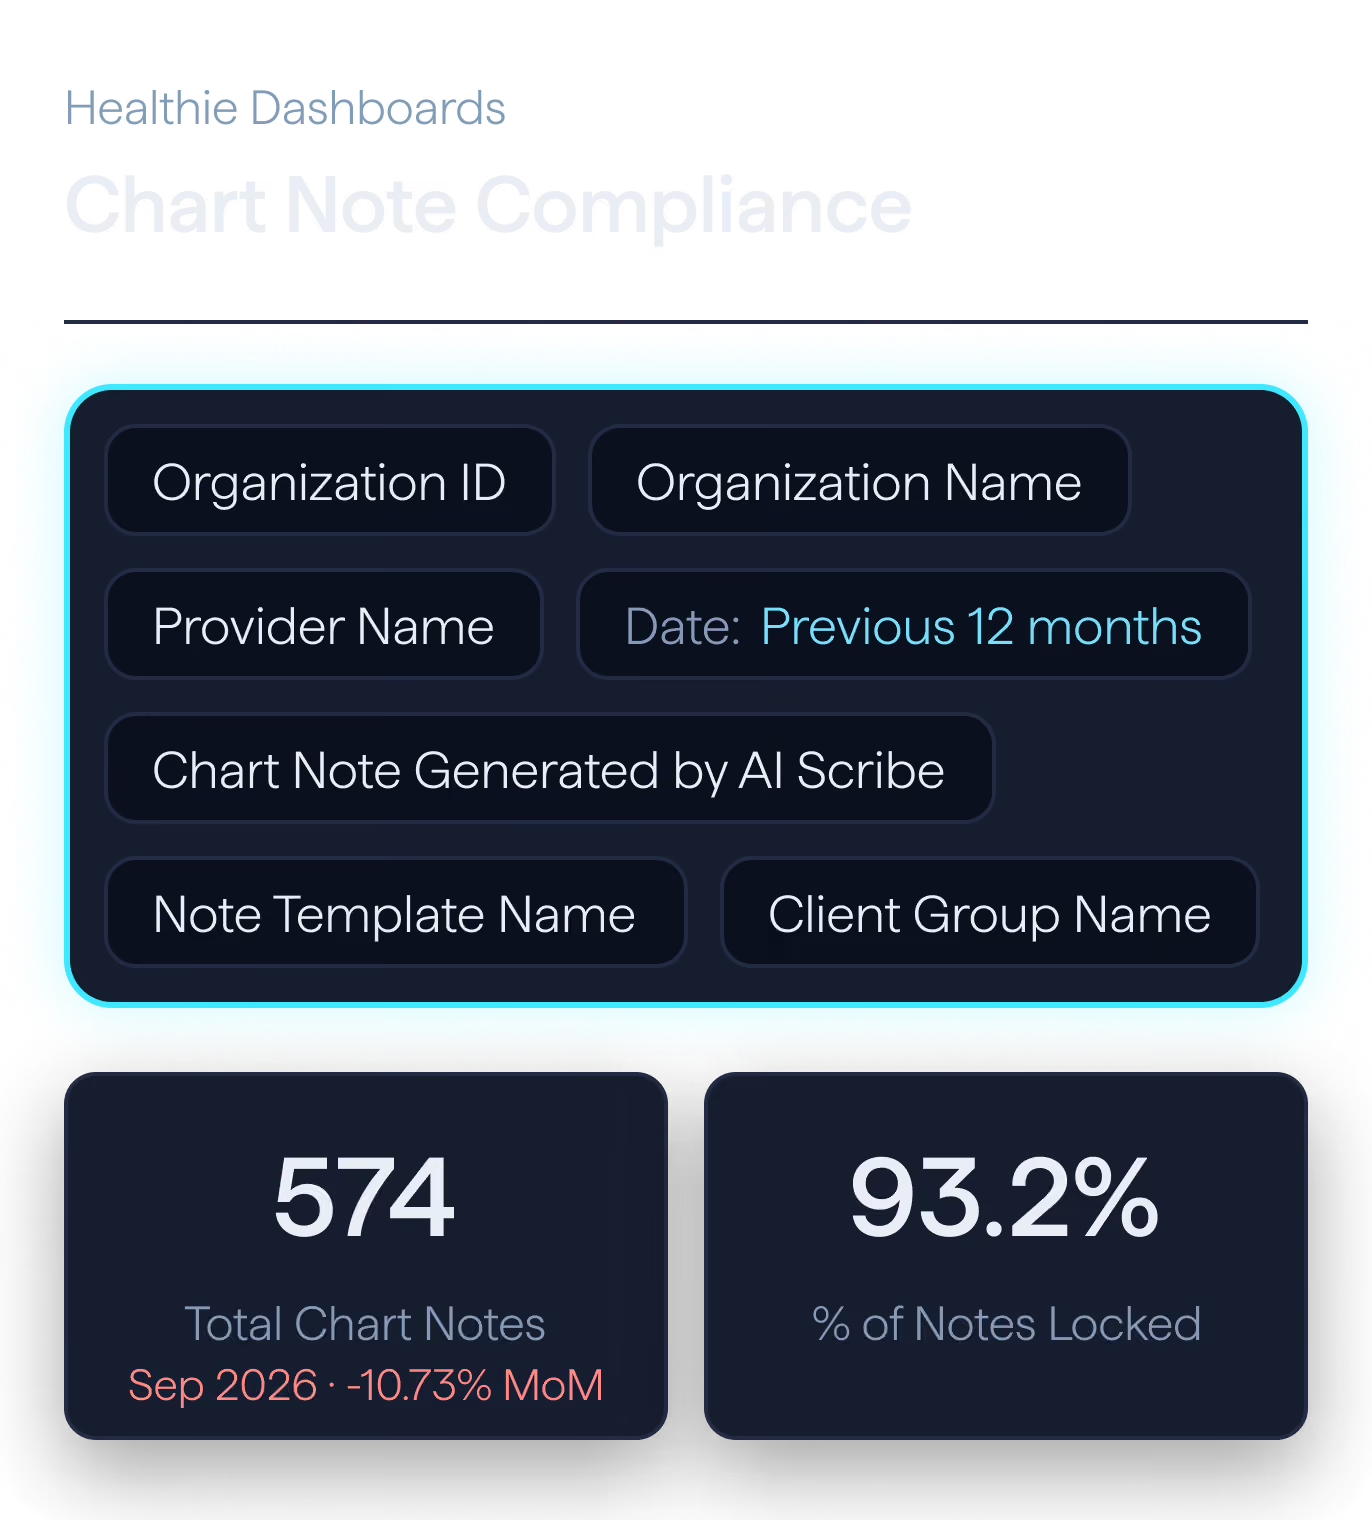
Start from a pre‑built dashboard, then shape it to the way your team works.
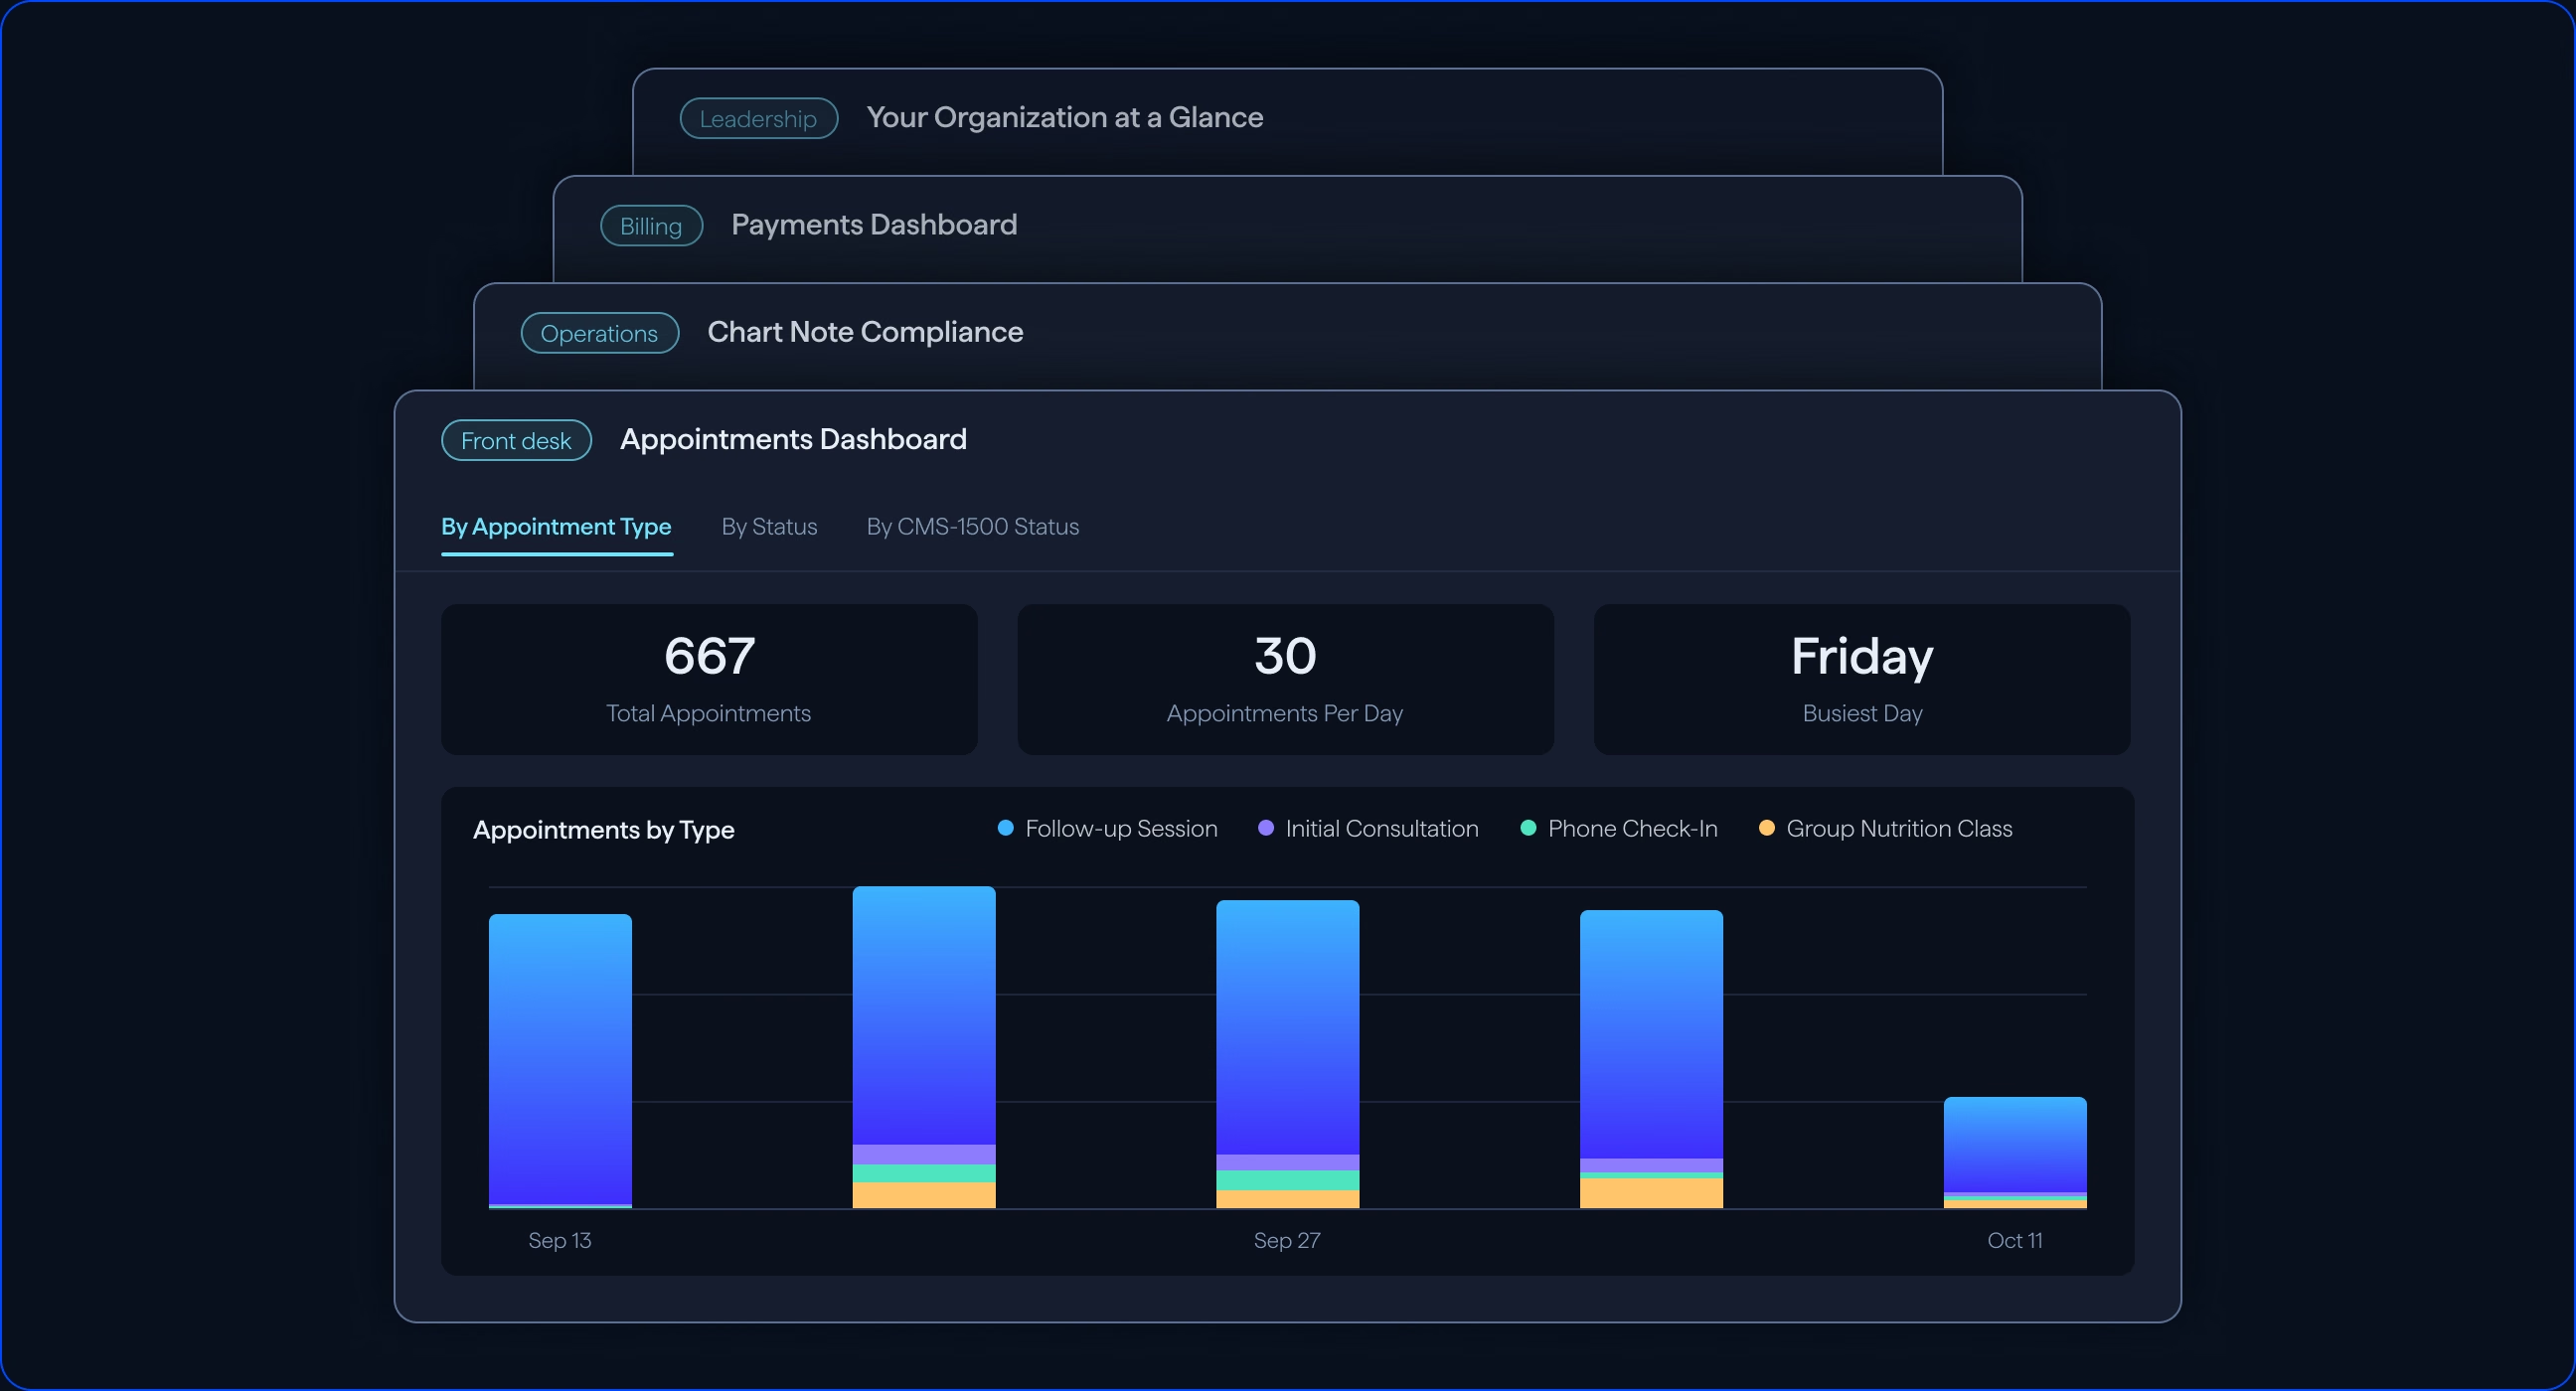
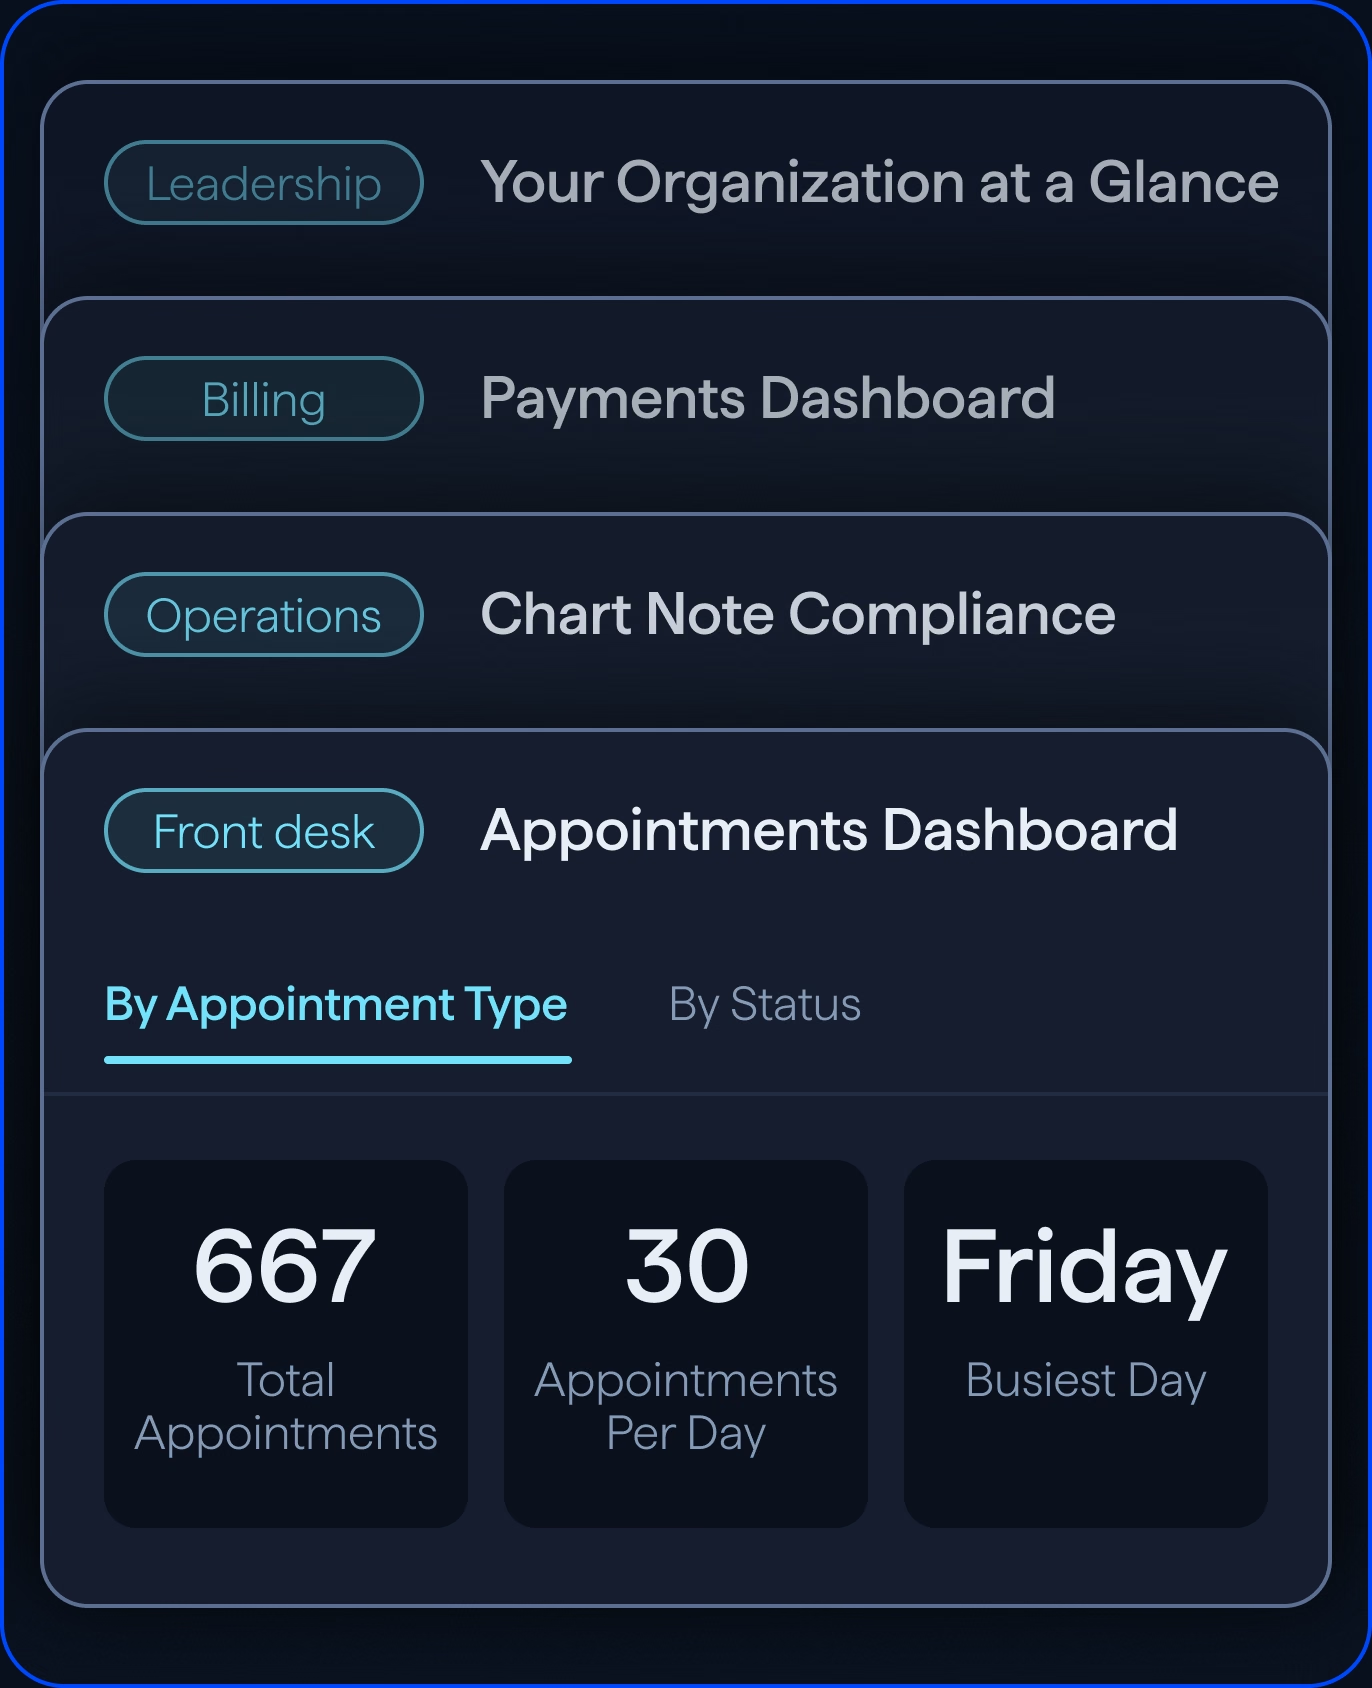
Practice owners & senior leadership
A 30-day pulse check on practice health: total appointments, unique patient counts and utilization at a glance.
Billing managers & CFOs
Payments and AR Aging dashboards track collections, failed payments and open balances over time.
Front desk leads & schedulers
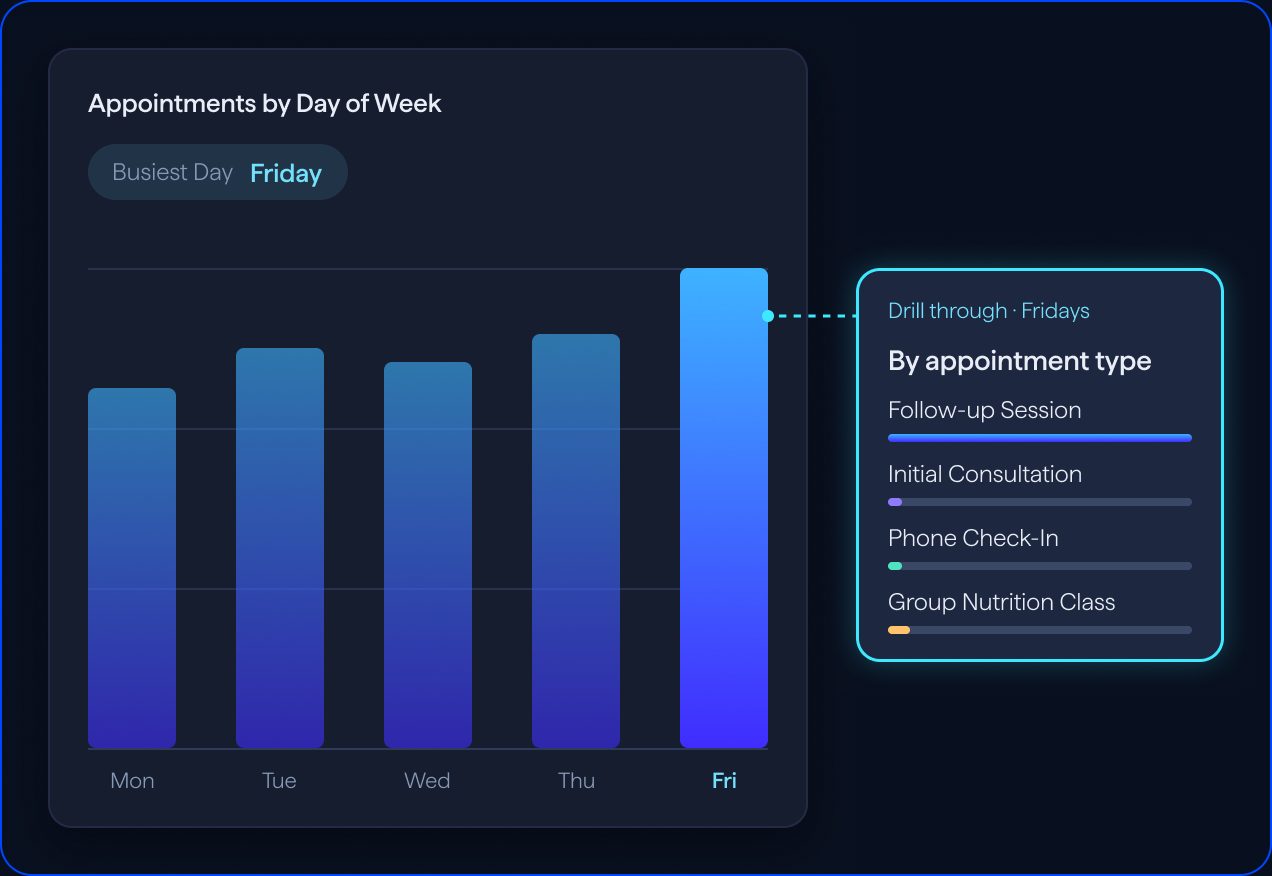
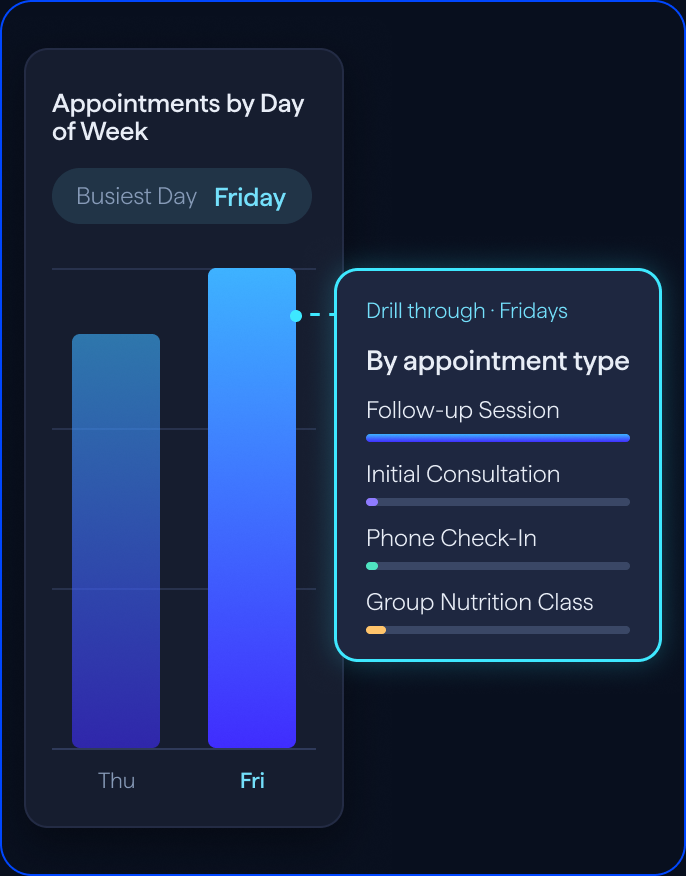
Appointment trends surface high-volume days, no-show patterns and cancellations by appointment type and provider.
Practice managers & operations directors
Provider utilization, chart note and task completion dashboards show capacity gaps and administrative bottlenecks.
QUESTIONS IT ANSWERS
The questions your team asks every week
Start from a dashboard instead of an export, then drill through to the detail behind each answer.
HOW IT WORKS
Turn Healthie data into dashboards you customize and act on
Visualize+ connects to your Healthie data and structures it for analysis, so your team starts with answers instead of setup.
Your data, already modeled
Healthie data is organized into ready-to-use models for patients, providers, appointments, payments and more.
Start from a pre‑built dashboard
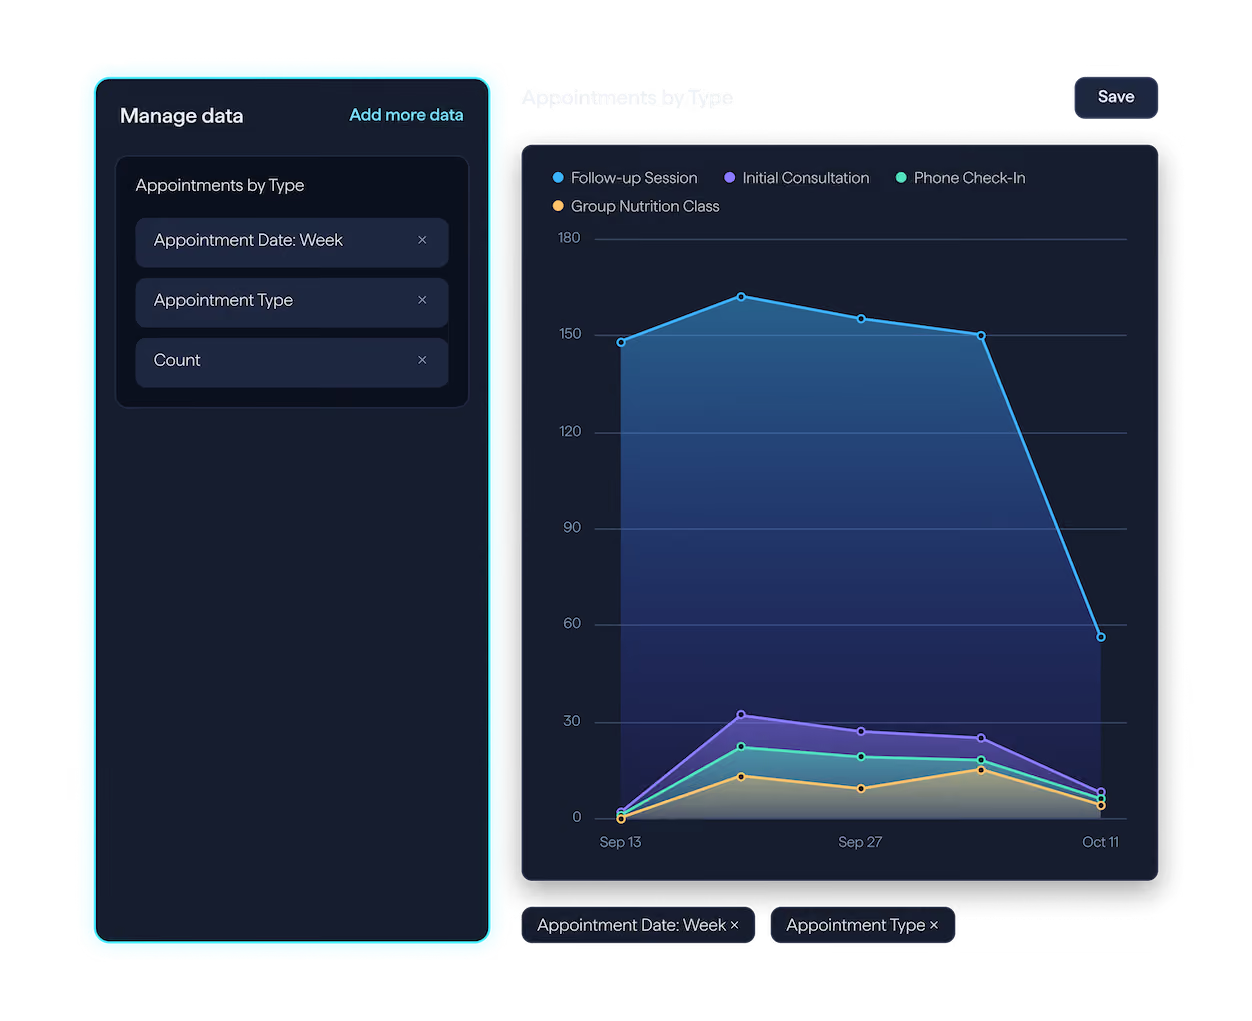
Edit, filter and drill through dashboards with no code.
Share what matters
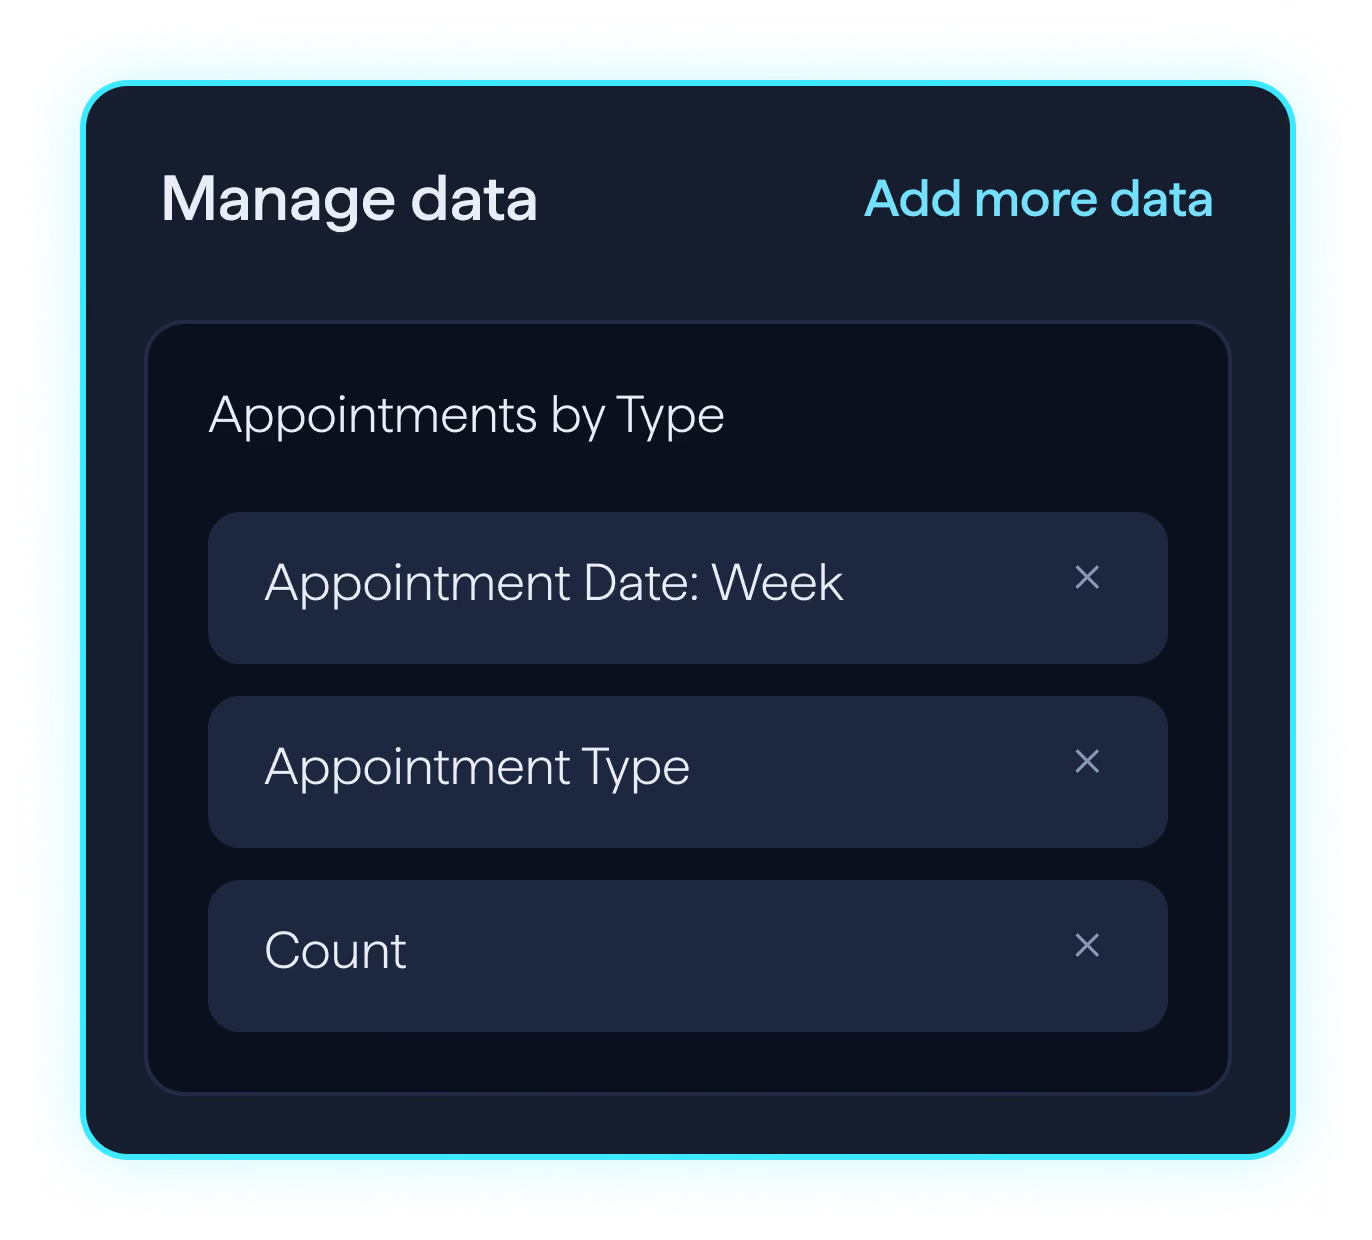
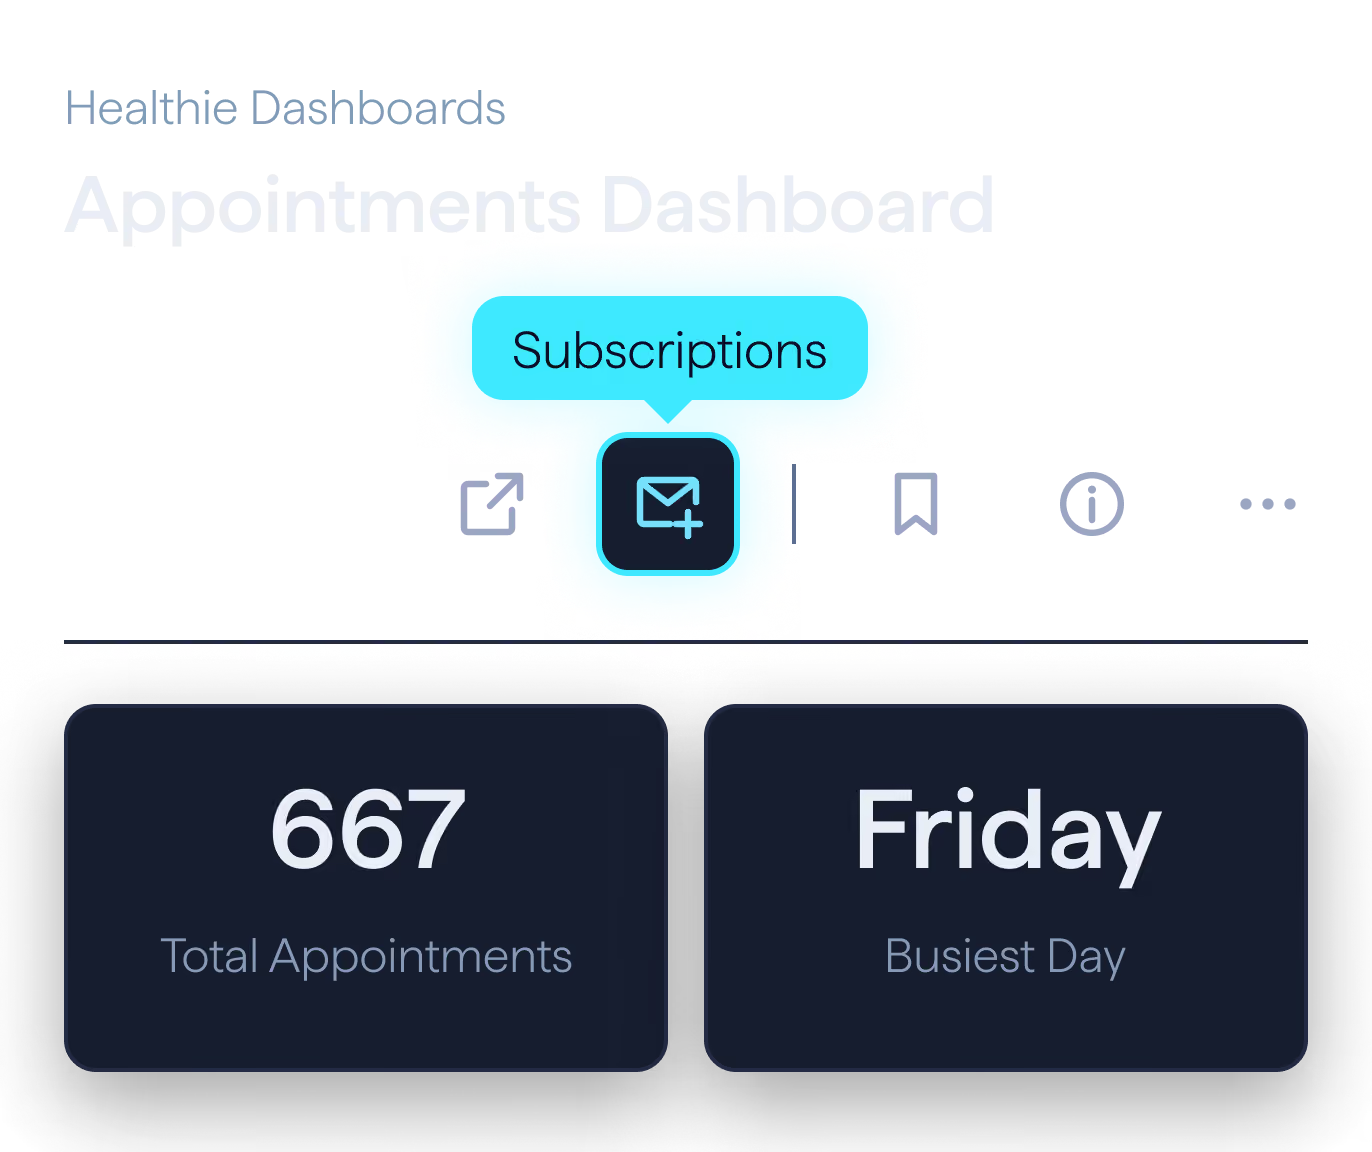
Send filtered dashboards to your team, schedule them on your cadence or get alerts when a metric crosses its goal line.
Ask Vizzy in plain language
Type a question the way you would ask a colleague, and Vizzy answers it.
DATA MODELS
Built on models that match how care is delivered
Your Healthie data arrives structured and ready to query. More models are added as Visualize+ grows.
- Patients, Providers & Dates
- Appointments
- Payments
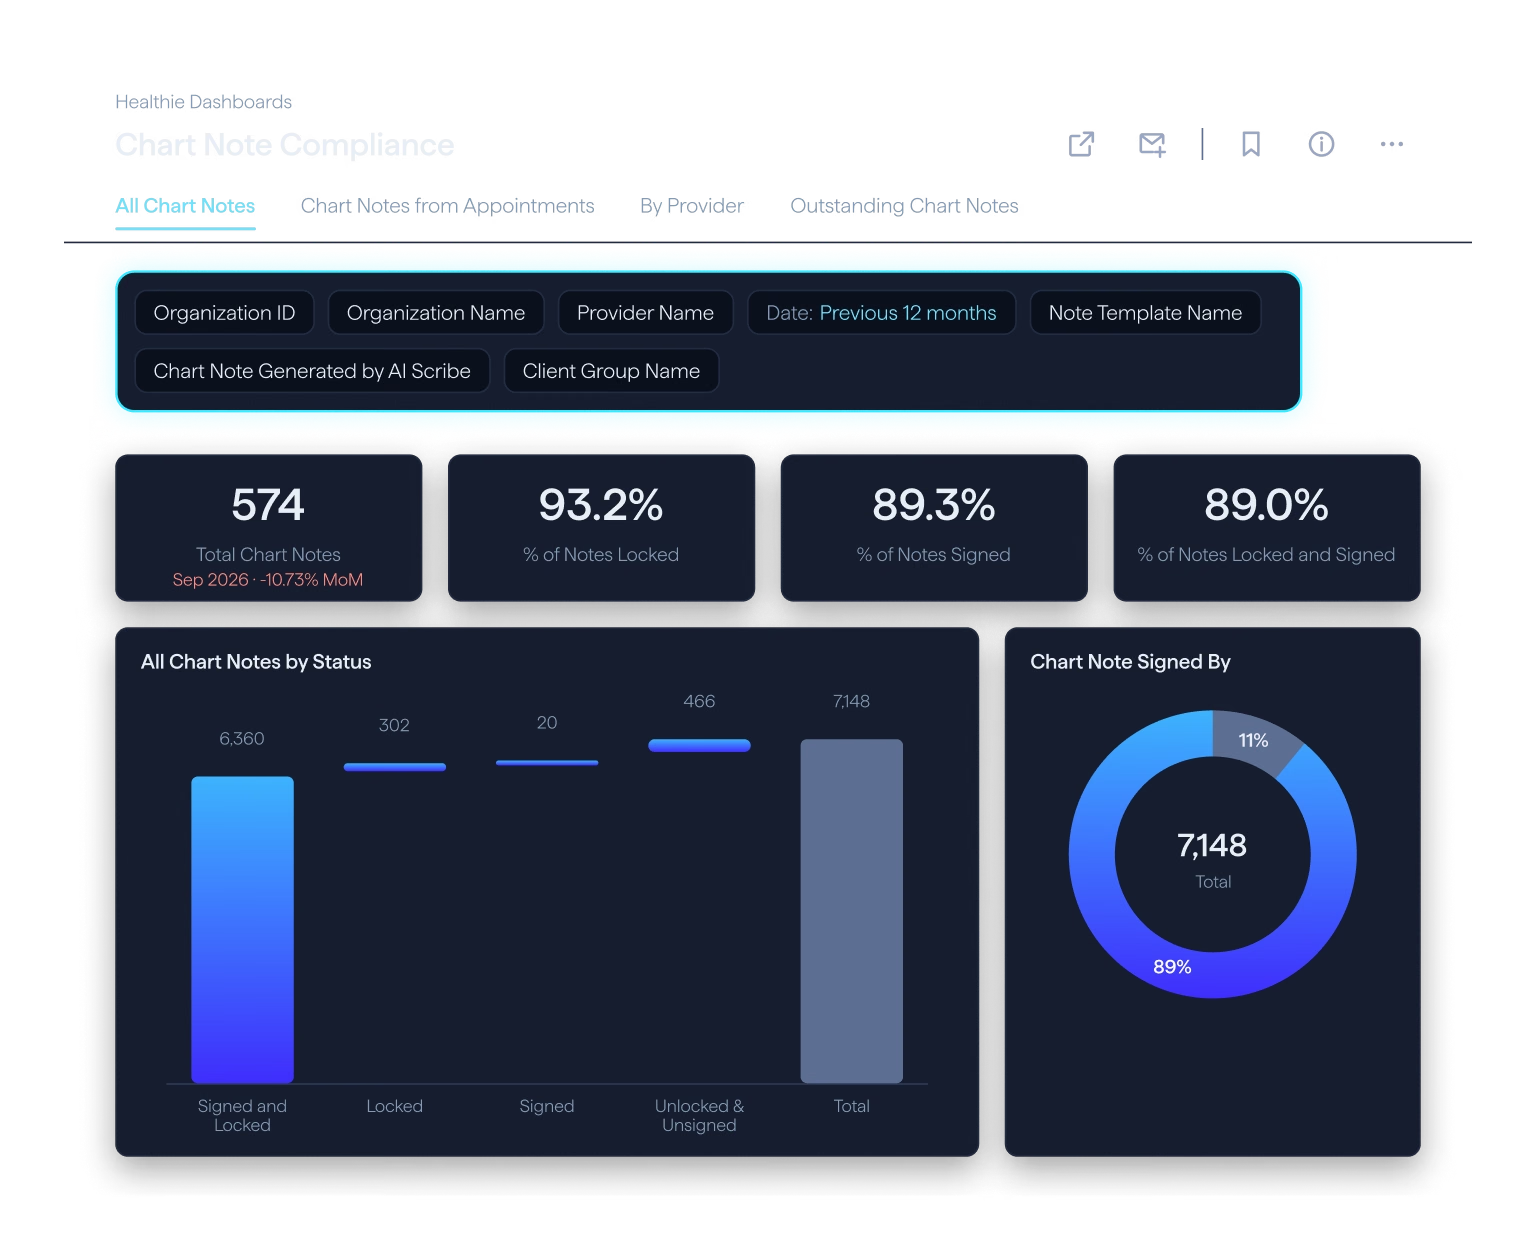
- Chart Note Compliance
- Provider Utilization
- Task Completion
Where it fits
Three ways to work with your Healthie data
Pick the level that matches your team, from the reports in every plan to raw data in your own warehouse.
In-app reports
Pre-built reports and dashboards in every plan.
No-code, interactive dashboards
Build, filter and share your own dashboards inside Healthie. A Group and Enterprise add‑on.
Raw data in your warehouse
Production-ready datasets delivered to your warehouse, for teams with data engineering.
WHAT IT REPLACES
Four things you no longer need
Visualize+ extracts, stores and models your Healthie data, so you can analyze it without a technical team.
ETL pipeline
Visualize+ extracts, transforms and loads your Healthie data so it is ready to query on day one.
Data warehouse
Your Healthie data is housed within Visualize+, with no external storage to maintain.
BI tool integration
Build and share dashboards inside Healthie, without connecting an outside BI tool.
Analyst requests
Ask Vizzy in plain language and get answers from your Healthie data, with minimal technical skills.
IS THIS FOR YOU
Is Visualize+ right for your team?
Visualize+ is built for organizations that need more than standard reports, without building a data team.